Commit Frequency & Development Activity
Track development activity and commit patterns over time
GitPulse tracks commit patterns and development activity to help you understand your team's productivity and development rhythm.
Development Activity Overview
The commit frequency analysis provides insights into how your team develops code, identifying patterns, trends, and opportunities for improvement.
Key Activity Metrics
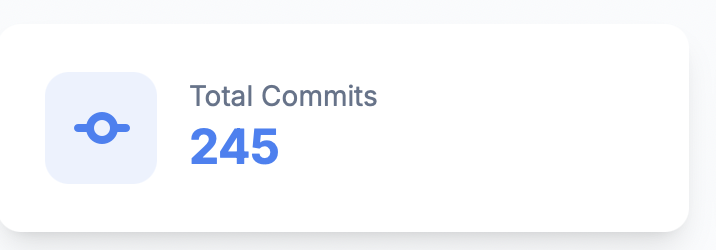
Total Commits
The total number of commits in the selected time period. This metric provides a basic count of development activity and can be filtered by date range to focus on specific periods.
What it tells you
- Overall development volume
- Activity level compared to previous periods
- Development momentum and engagement
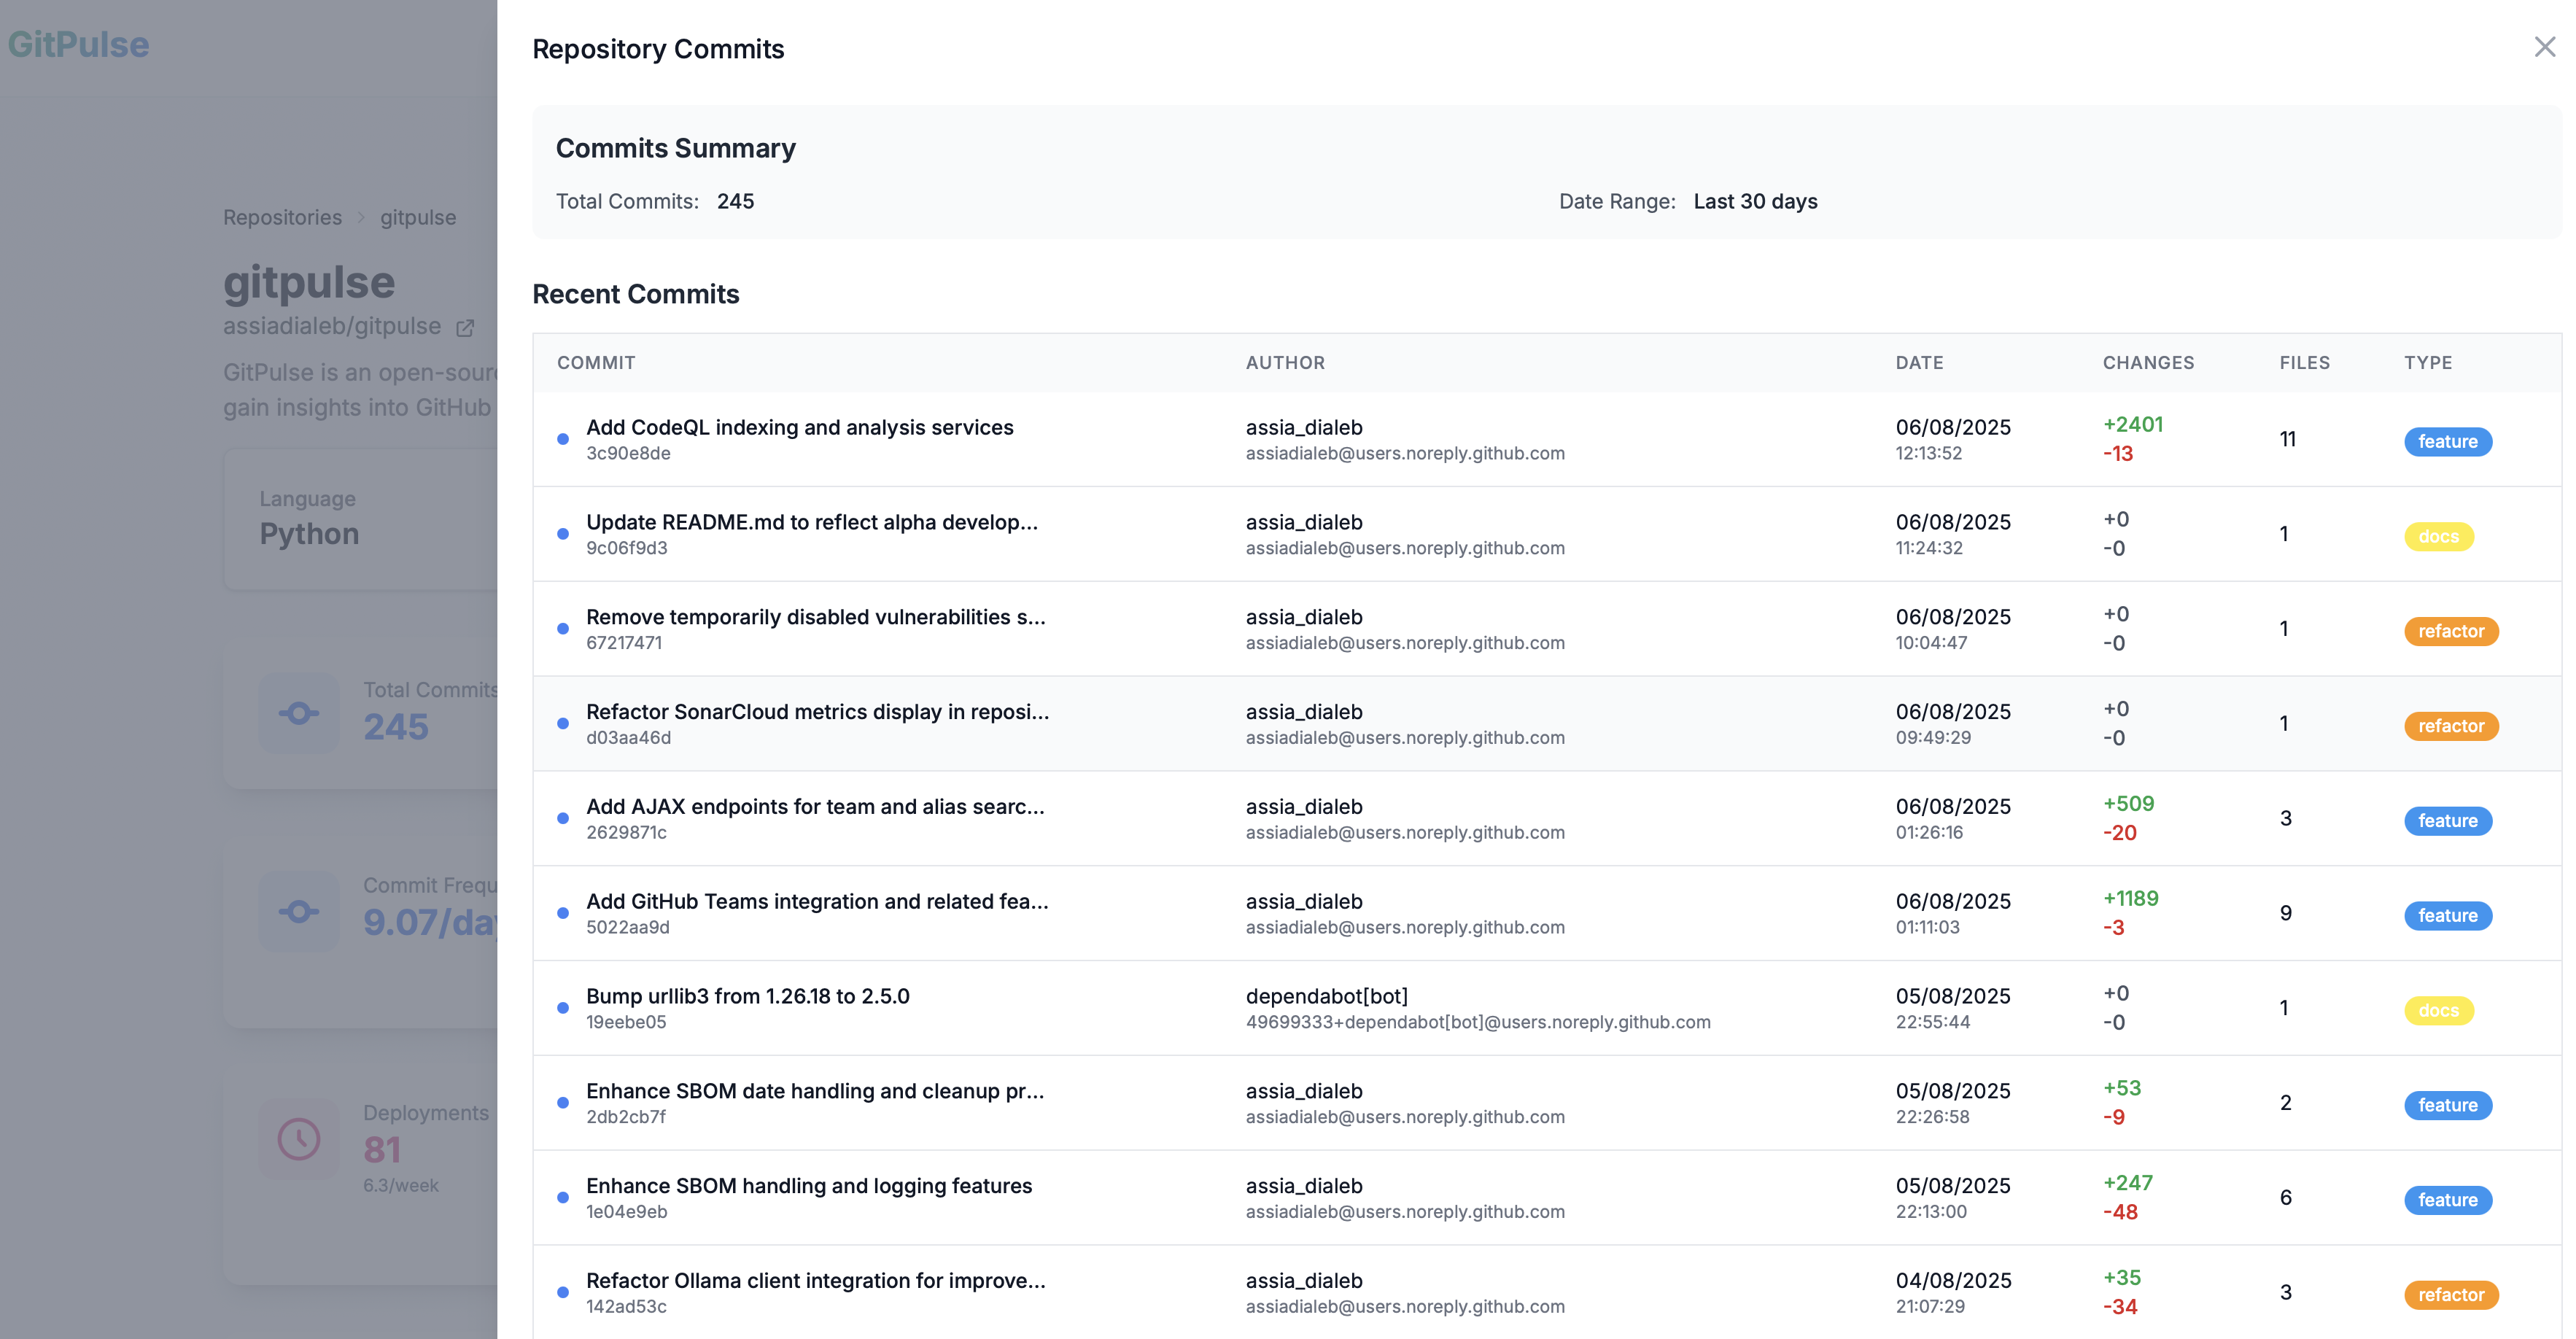
Commits Details
Click on the Total Commits metric to access a detailed breakdown showing: - Individual commit details - Commit messages and descriptions - Developer attribution - File changes and impact
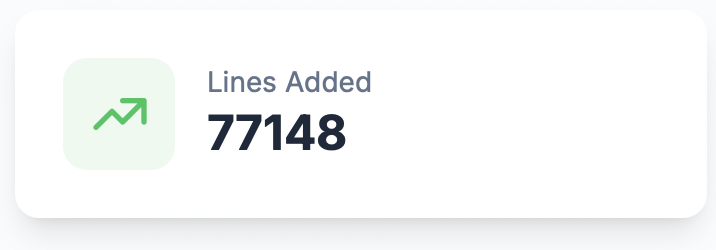
Lines Added
The total number of lines of code added during the selected period. This metric tracks code growth and development progress.
What it tells you
- Code expansion rate
- Development velocity
- Feature development progress
Commit Change Stats
Detailed statistics about code changes including: - Lines added vs. lines removed - File modification patterns - Change distribution across the codebase
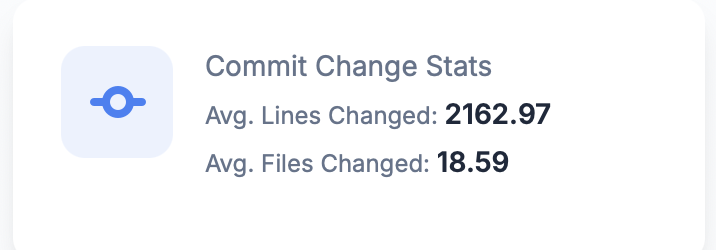
What it tells you
- Development vs. maintenance balance
- Code churn and stability
- Refactoring vs. new feature development
Commit Frequency
The rate at which commits are made over time, measured as commits per day, week, or month depending on the selected time period.
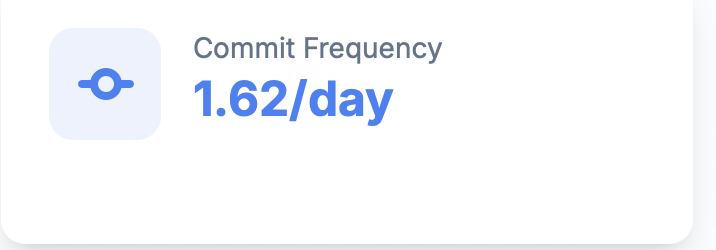
What it tells you
- Development rhythm and consistency
- Team productivity patterns
- Project activity health
Advanced Activity Metrics
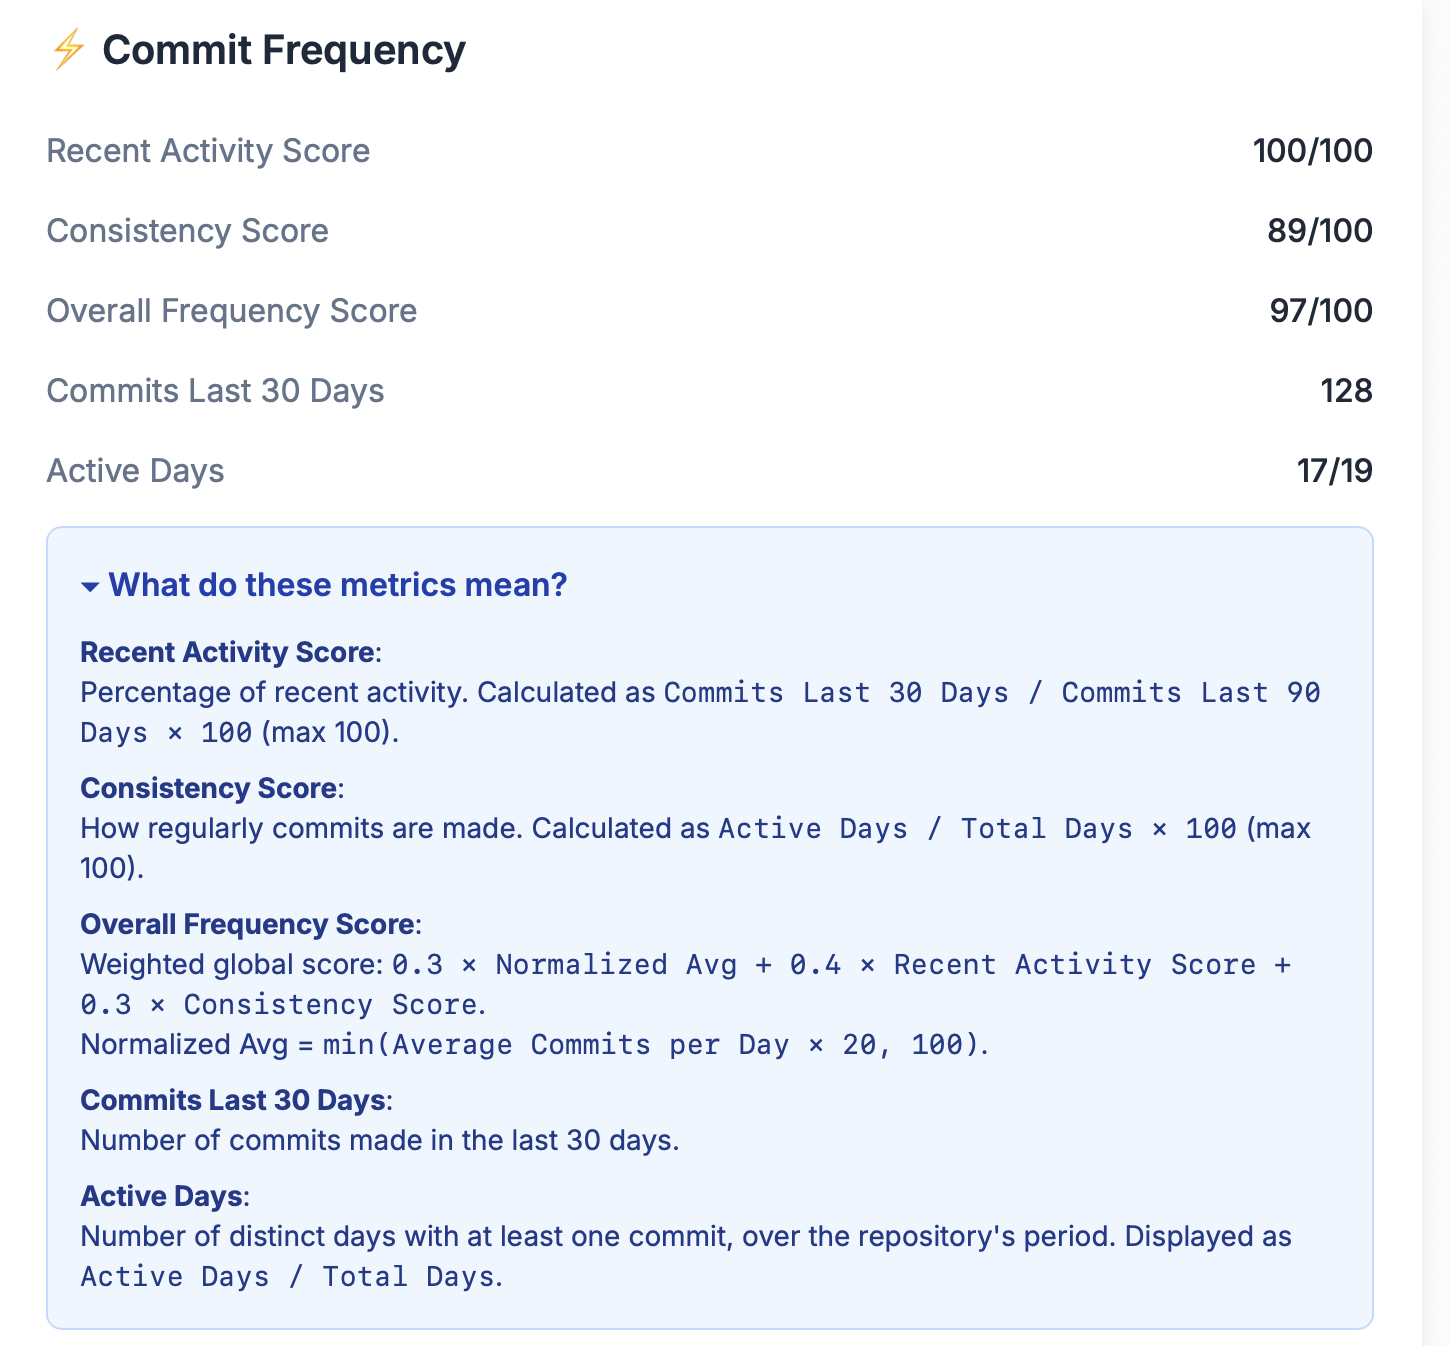
Recent Activity Score
Measures the proportion of commits made in the last 30 days relative to the last 90 days:
- 100: High recent engagement
- 80-99: Good recent activity
- 60-79: Moderate recent activity
- 40-59: Low recent activity
- 0-39: Very low recent activity
What it tells you
- Whether development is accelerating or slowing
- If the team is actively working on the project
- Recent momentum compared to historical patterns
Consistency Score
Measures how regularly commits occur over time:
- 100: Very consistent development rhythm
- 80-99: Good consistency
- 60-79: Moderate consistency
- 40-59: Irregular patterns
- 0-39: Very inconsistent development
What it tells you
- Whether development follows a predictable schedule
- If the team has established good habits
- How well the development process is structured
Overall Frequency Score
A weighted score combining average commit frequency, recency, and consistency:
- 100: Excellent development health
- 80-99: Good development health
- 60-79: Fair development health
- 40-59: Poor development health
- 0-39: Critical development health
What it tells you
- Overall assessment of development activity
- Whether the project is healthy and active
- If intervention is needed to improve productivity
Activity Breakdown
Commits Last 30 Days
Raw count of commits over the last month:
- High (50+): Very active development
- Medium (20-49): Normal development activity
- Low (5-19): Light development activity
- Very Low (0-4): Minimal development activity
Active Days
Total days with at least one commit activity:
- High (20+ days): Consistent daily development
- Medium (10-19 days): Regular development
- Low (5-9 days): Intermittent development
- Very Low (0-4 days): Rare development activity
Time-Based Analysis
Commit Activity by Hour
This visualization shows when commits occur throughout the day:
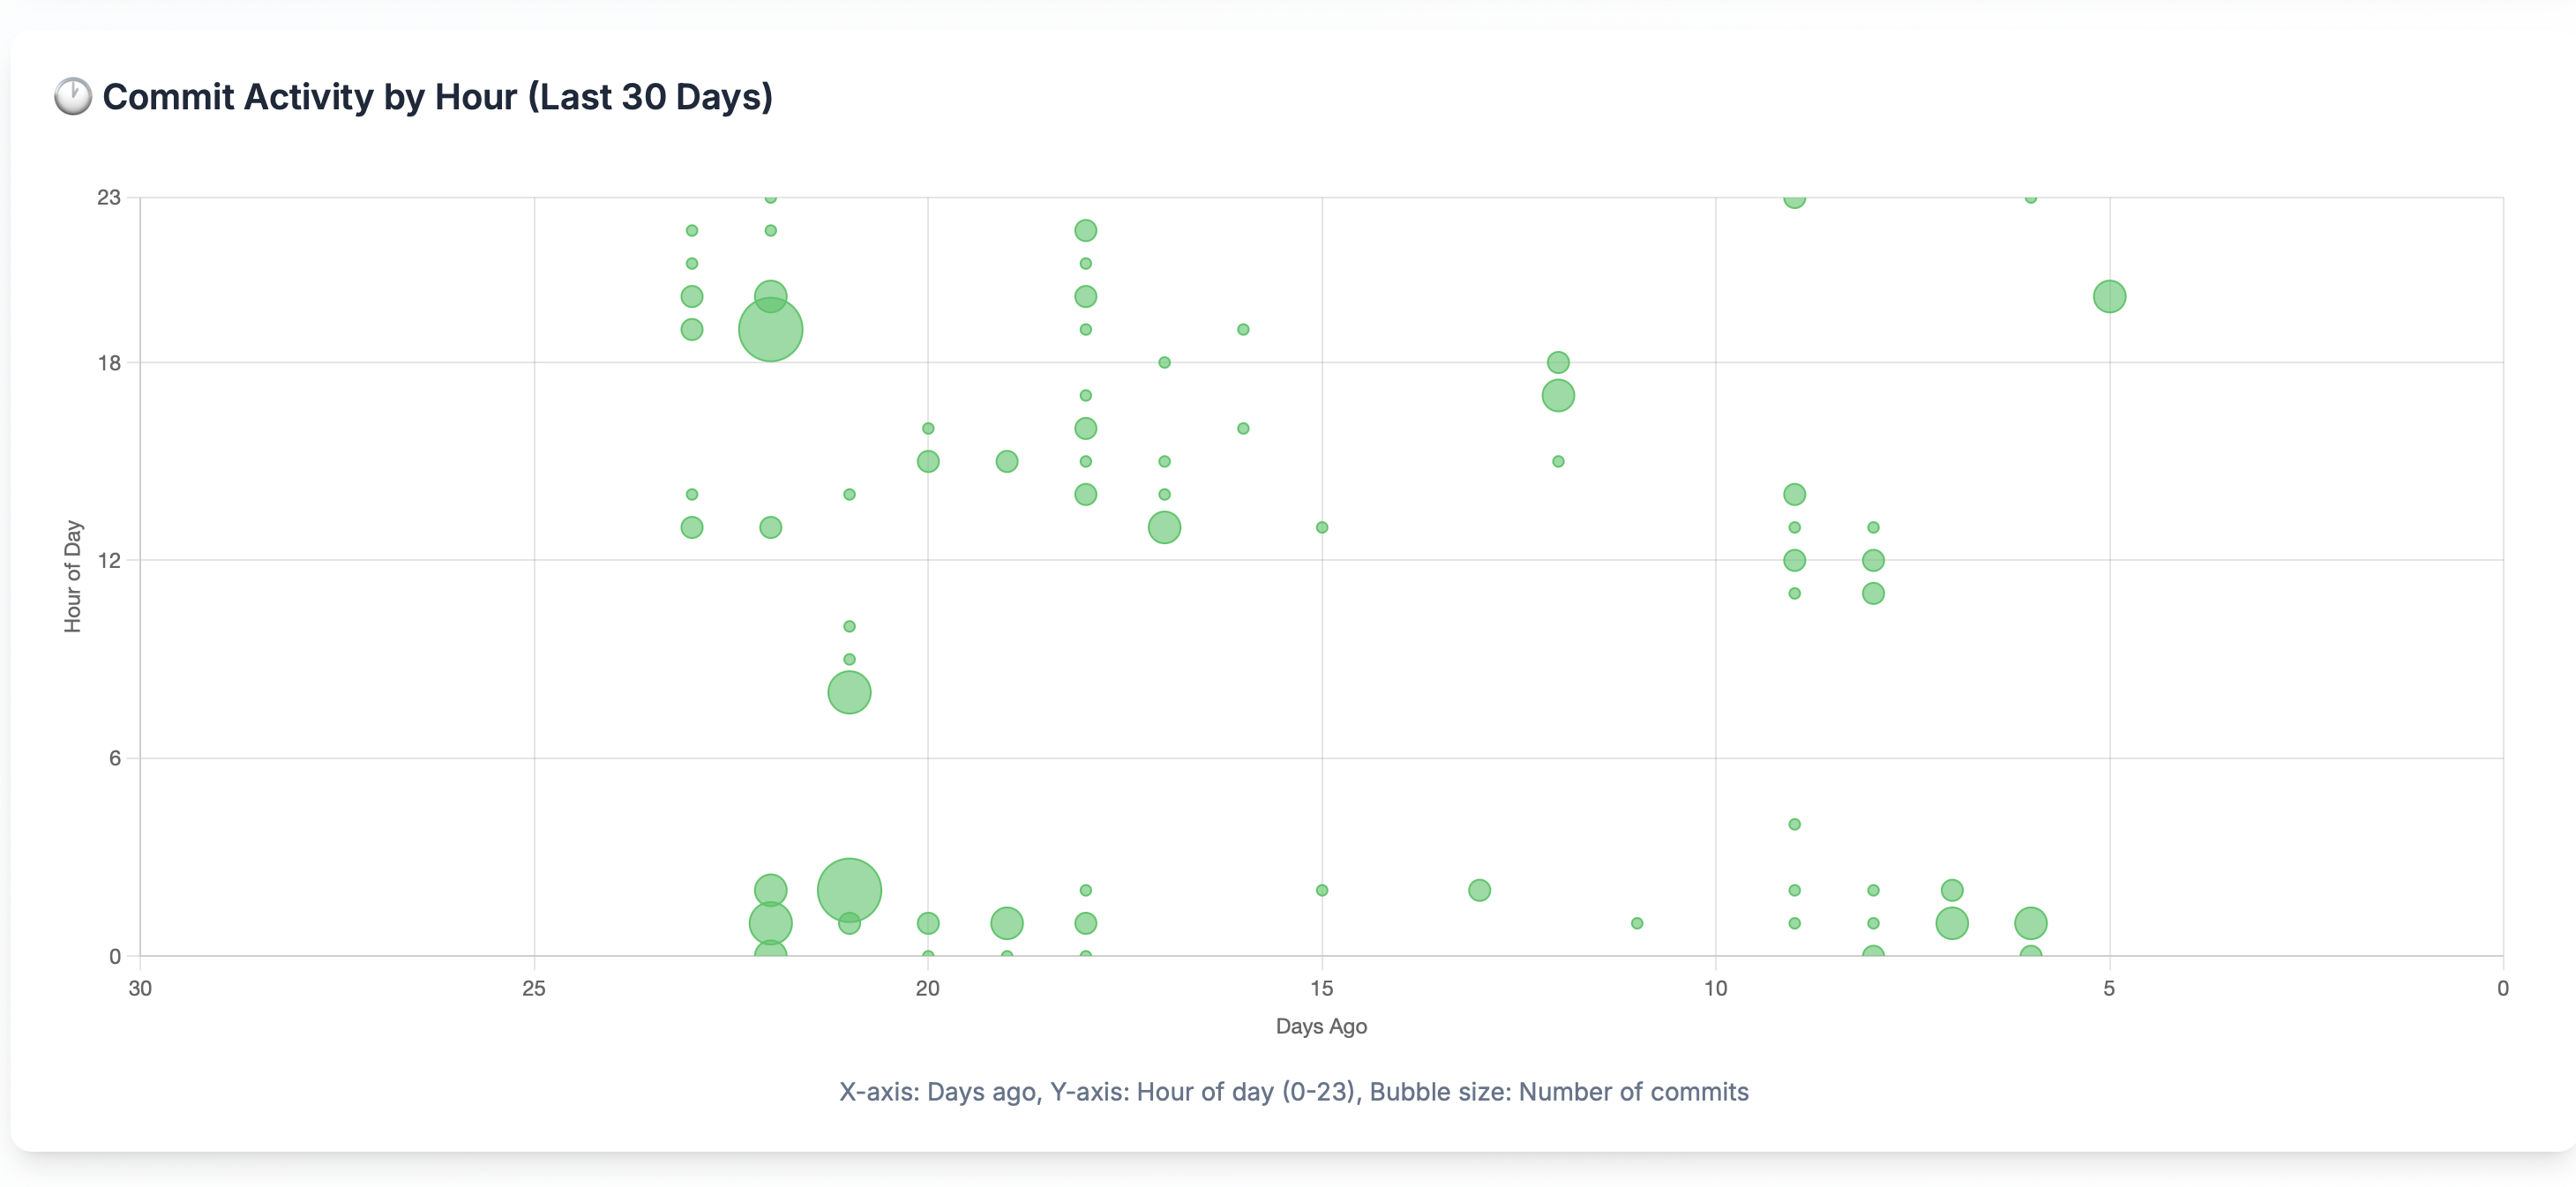
What it reveals
- Peak Hours: When the team is most active
- Working Patterns: Typical development schedules
- Global Teams: Multiple timezone activity
- Overtime Patterns: After-hours development
Weekly Patterns
Track activity across different days of the week:
- Monday: Start-of-week activity levels
- Midweek: Peak development days
- Friday: End-of-week patterns
- Weekend: Off-hours development
Development Health Indicators
Healthy Development Patterns
Good signs
- Consistent daily commits
- Regular activity throughout the week
- Balanced distribution across team members
- Steady progress over time
Concerning patterns
- Long periods without commits
- All activity concentrated in few days
- Single developer doing most work
- Declining activity over time