Developer Impact & Performance Metrics
Comprehensive evaluation of developer contributions, code quality, and security impact
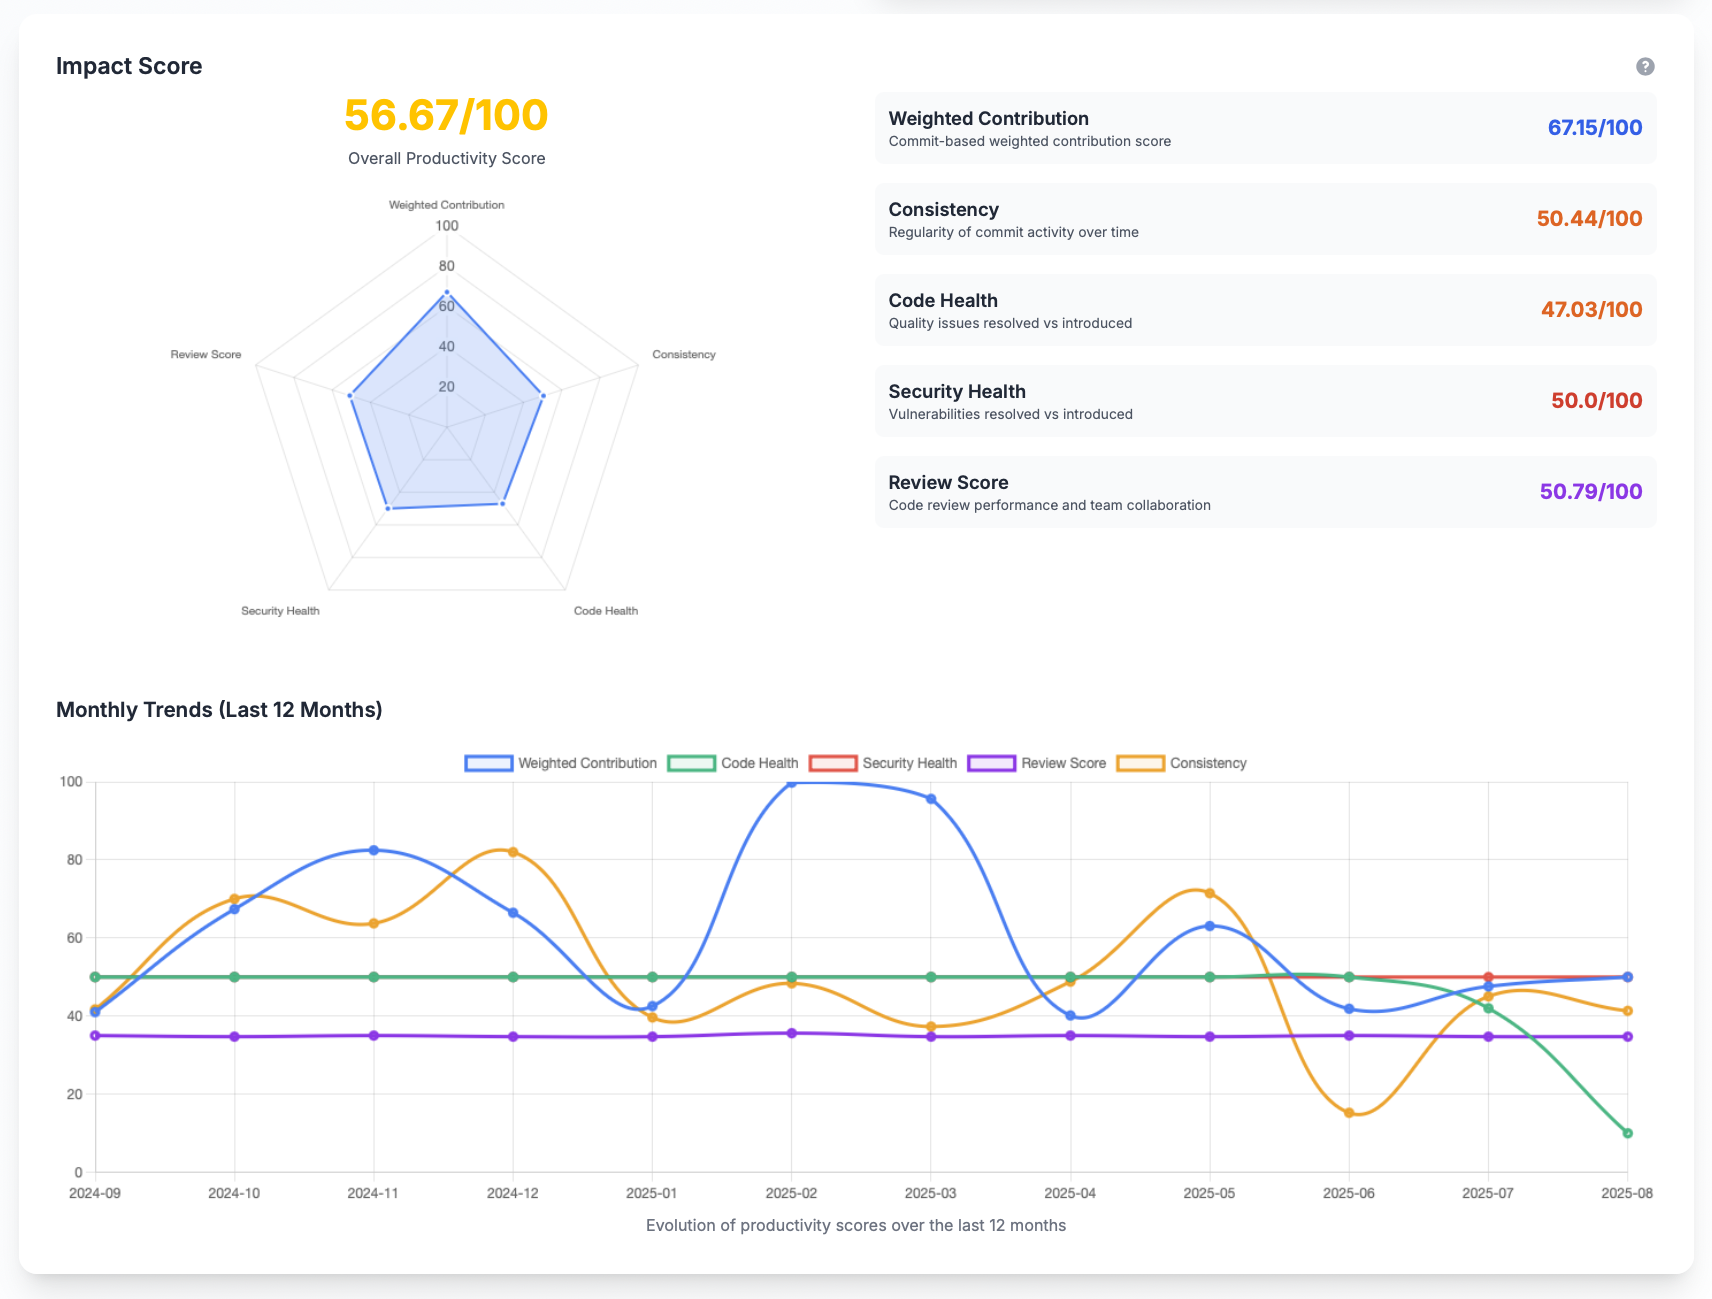
GitPulse provides three key impact scores to evaluate developer performance and contribution quality. These metrics help managers understand individual developer impact, identify team strengths, and support performance discussions.
Impact Score Overview
The five impact scores work together to provide a holistic view of developer performance:
- Weighted Contribution Score: Measures technical impact and productivity
- Consistency Score: Evaluates regularity of commit activity over time
- Code Health Score: Evaluates quality improvement vs. technical debt introduction
- Security Health Score: Assesses security vulnerability management
- Review Score: Evaluates code review performance and team collaboration
Overall Productivity Score
What It Measures
The Overall Productivity Score combines the four component scores into a single, weighted metric on a 0–100 scale. It reflects a balanced view of contribution volume, code quality, security posture, and review effectiveness.
Calculation Formula
Formula
Base_Score = 0.40 × Weighted_Contribution + 0.20 × Code_Health + 0.20 × Security_Health + 0.20 × Review_Score
Consistency_Multiplier = 0.5 + (Consistency_Score / 100)
Overall = Base_Score × Consistency_Multiplier
Impact Example
Consider a developer with excellent scores but irregular work patterns:
- Weighted Contribution: 80
- Code Health: 70
- Security Health: 80
- Review Score: 70
- Consistency Score: 30
Consistency_Multiplier = 0.5 + (30/100) = 0.8
Overall = min(100, 76 × 0.8) = 60.8
The final score of 60.8 better reflects the risk of irregularity, encouraging more consistent work patterns.
Note: The final score is capped at 100 to maintain a consistent scale.
- Weighted_Contribution: Normalized to 0–100 (scaled from raw contribution score)
- Code_Health: Already represented on a 0–100 scale (50 is neutral)
- Security_Health: 0–100 radar-based score (50 is neutral)
- Review_Score: 0–100 (50 is team-average performance)
Component Normalization Details
To ensure a fair combination, component scores are normalized:
- Weighted Contribution: Raw productivity score is scaled to 0–100. In practice, we multiply by 0.5 and cap at 100 to keep values in a meaningful range.
- Code Health: Centered on 50 as neutral. Internally shifted to the 0–100 band (values below 50 indicate net degradation, above 50 indicate net improvement).
- Security Health: Already a 0–100 radar ratio (default 50 if no activity).
- Review Score: 0–100 additive model. Base points use Z-Score (bounded), plus quality and diversity points.
Weighting Rationale
- 40% Weighted Contribution: Prioritizes tangible delivery and code changes.
- 20% Code Health: Rewards improvements in code maintainability and quality.
- 20% Security Health: Emphasizes secure-by-design practices.
- 20% Review Score: Encourages healthy collaboration and review effectiveness.
Weighted Contribution Score
What It Measures
The Weighted Contribution Score evaluates a developer's technical impact based on their commit activity, weighted by the type and significance of their contributions.
Calculation Formula
Formula
Score = Σ(log(max(5, additions + deletions)) × type_weight)
Where:
additions + deletions: Total lines of code changed in each commitmax(5, ...): Ensures a minimum threshold for meaningful contributions. Commits with less than 5 lines are often minor formatting corrections or "polish" that don't add real technical value. They can fragment Git history without valid reason.log(...): Reduces the impact of extremely large commits. Massive commits (hundreds/thousands of lines) can indicate overly broad refactoring or long branch merges. They make code difficult to review and can introduce bugs that are hard to identify. The logarithmic function encourages medium-sized commits (10-100 lines) that are optimal for maintenance and review.type_weight: Commit type weighting factor
Commit Type Weights
Different types of commits are weighted to reflect their business value:
| Commit Type | Weight | Description |
|---|---|---|
| feat | 2.5 | New features and functionality |
| refactor | 3.0 | Major code restructuring and improvements |
| fix | 1.5 | Bug fixes and corrections |
| test | 1.0 | Test additions and improvements |
| perf | 1.8 | Performance optimizations |
| chore | 0.5 | Maintenance tasks and routine work |
| docs | 0.5 | Documentation updates |
| style | 0.3 | Code formatting and style changes |
| ci | 0.4 | CI/CD configuration changes |
| build | 0.4 | Build system modifications |
| revert | 0.1 | Code reversions |
| other | 1.0 | Unclassified commits |
What It Tells You
Individual Developer Insights:
- High Score (80-100): Developer making significant technical contributions
- Medium Score (40-79): Consistent contributor with moderate impact
- Low Score (0-39): Limited technical contribution or new team member
Team Management Insights:
- Productivity Trends: Track individual performance over time
- Contribution Balance: Identify overworked or underutilized team members
- Skill Development: Monitor growth in technical impact
Performance Discussion Support:
- Recognition: Celebrate high performers and their contributions
- Development: Identify areas for skill improvement
- Support: Recognize when developers may need assistance
Consistency Score
What It Measures
The Consistency Score evaluates how regular a developer's commit activity is over time. A high score indicates stable, predictable work patterns, while a low score suggests irregular activity with peaks and valleys.
Calculation Formula
Formula
Weekly_Value = Σ(log(max(5, additions + deletions)) × type_weight) for commits in week
CV = std_dev(weekly_values) / mean(weekly_values)
Consistency_Score = 100 × (1 - min(CV, 1.0))
How It Works
- Weekly Aggregation: Commits are grouped by week within the analysis period
- Weekly Value Calculation: Each week's total commit value is calculated using the Weighted Contribution formula
- Variance Measurement: Coefficient of Variation (CV) measures the relative standard deviation
- Score Normalization: Score = 100 × (1 - CV), capped to ensure 0-100 range
What It Tells You
Individual Developer Insights:
- High Score (80-100): Developer maintains consistent work patterns
- Medium Score (40-79): Moderate consistency with some variation
- Low Score (0-39): Irregular activity patterns
Team Management Insights:
- Predictability: Identify developers with stable vs. variable work patterns
- Workload Planning: Better resource allocation for consistent contributors
- Process Improvement: Identify if irregular patterns indicate process issues
Performance Discussion Support:
- Recognition: Acknowledge developers who maintain steady contributions
- Support: Help developers establish more consistent work patterns
- Process Review: Investigate if irregular patterns indicate external factors
Code Health Score
What It Measures
The Code Health Score evaluates a developer's impact on code quality by measuring the balance between issues they've resolved versus those they've introduced. The score ranges from 0 to 100, where 50 represents a neutral impact (no issues introduced or resolved).
Calculation Formula
Formula
Score = (Σ Resolved_Weights) - (Σ Introduced_Weights)
Where:
Resolved_Weights: Weight of quality issues resolved by the developerIntroduced_Weights: Weight of quality issues introduced by the developer
Issue Type Weights
Quality issues are weighted by severity and type:
| Issue Type | Severity | Weight |
|---|---|---|
| Vulnerability | Critical/Major | 10 |
| Vulnerability | Minor/Info | 5 |
| Bug | Critical | 8 |
| Bug | Major | 5 |
| Bug | Minor/Info | 3/1 |
| Code Smell | Critical/Major | 5/3 |
| Code Smell | Minor/Info | 1 |
| Security Hotspot | Critical/Major | 10/8 |
| Security Hotspot | Minor/Info | 5/3 |
What It Tells You
Individual Developer Insights:
- Score > 50: Developer improves code quality more than they degrade it
- Score < 50: Developer introduces more issues than they resolve
- Score = 50: Developer maintains neutral impact on code quality
Team Management Insights:
- Quality Champions: Developers who consistently improve code health
- Training Needs: Developers who may need guidance on best practices
- Code Review Effectiveness: Whether the review process catches quality issues
Performance Discussion Support:
- Recognition: Acknowledge developers who maintain high code quality
- Mentoring: Pair high-quality developers with those who need guidance
- Process Improvement: Identify if additional training or review processes are needed
Security Health Score
What It Measures
The Security Health Score evaluates a developer's impact on application security by measuring their vulnerability management effectiveness. The score ranges from 0 to 100, where 50 represents a neutral impact (no vulnerabilities introduced or resolved).
Calculation Formula
Formula
Score = (Σ Resolved_Vuln_Weights / (Σ Resolved_Vuln_Weights + Σ Introduced_Vuln_Weights)) × 100
Where:
Resolved_Vuln_Weights: Weight of vulnerabilities resolved by the developerIntroduced_Vuln_Weights: Weight of vulnerabilities introduced by the developer
Special Cases:
- No vulnerabilities: Score defaults to 50 (neutral)
- Only resolved vulnerabilities: Score approaches 100
- Only introduced vulnerabilities: Score approaches 0
Score Examples:
- 0 introduced, 0 resolved: Score = 50 (neutral)
- 2 resolved, 0 introduced: Score ≈ 56 (slightly positive)
- 0 resolved, 7 introduced: Score ≈ 26 (negative impact)
Vulnerability Weights
Security issues are weighted by severity:
| Severity | Weight | Description |
|---|---|---|
| Critical | 100 | Severe security vulnerabilities |
| High | 50 | Significant security risks |
| Medium | 25 | Moderate security concerns |
| Low | 10 | Minor security issues |
False Positive Handling
The score excludes false positives to ensure accuracy:
- SonarCloud: Excludes issues marked as
FALSE-POSITIVE - CodeQL: Excludes dismissed vulnerabilities with reason
false_positive
What It Tells You
Individual Developer Insights:
- High Score (80-100): Developer actively improves security posture
- Medium Score (50-79): Developer maintains security-neutral impact
- Low Score (0-49): Developer may need security training or guidance
Team Management Insights:
- Security Champions: Developers who consistently improve security
- Risk Areas: Developers who may need additional security training
- Security Culture: Whether the team prioritizes security in development
Performance Discussion Support:
- Recognition: Celebrate developers who maintain high security standards
- Training: Identify security training needs
- Process Improvement: Ensure security is integrated into development workflows
Review Score
What It Measures
The Review Score evaluates a developer's effectiveness in code review activities and team collaboration. It measures how well they contribute to code quality through reviews, their review diversity, and their impact on team knowledge sharing.
Calculation Formula
Formula (Additive Model)
Base_Points = clamp(25 + 5 × Z, 0..50)
Quality_Points = 25 × changes_requested_ratio
Diversity_Points = 25 × (unique_authors_reviewed / team_size)
Final_Score = clamp(Base_Points + Quality_Points + Diversity_Points, 0..100)
Where:
Z: Z-Score of developer's review ratio vs. team averagechanges_requested_ratio: Share of reviews where changes were requested (0..1)unique_authors_reviewed / team_size: Diversity of collaboration (0..1)
Z-Score Calculation
Formula
Z = (dev_review_ratio - team_mean) / team_std_dev
Where:
dev_review_ratio: Developer's reviews / Total team reviewsteam_mean: Average review ratio across team membersteam_std_dev: Standard deviation of team review ratios
Points Calculations
Quality Points:
Formula
Quality_Points = 25 × changes_requested_ratio
Diversity Points:
Formula
Diversity_Points = 25 × (unique_authors_reviewed / team_size)
Review Metrics
The score incorporates several key metrics:
| Metric | Description | Impact on Score |
|---|---|---|
| Reviews Done | Total number of reviews completed | Base contribution measure |
| Team Total Reviews | Total reviews across the team | Context for individual performance |
| Unique Authors | Number of different developers reviewed | Collaboration diversity |
| Team Size | Number of team members | Context for diversity calculation |
| Changes Requested % | Percentage of reviews requesting changes | Quality indicator |
| Z-Score | Performance relative to team average | Statistical performance measure |
What It Tells You
Individual Developer Insights:
- High Score (80-100): Excellent reviewer with diverse contributions
- Medium Score (40-79): Good reviewer with room for improvement
- Low Score (0-39): Limited review activity or collaboration
Team Management Insights:
- Review Distribution: Whether review workload is balanced across the team
- Collaboration Patterns: How well team members work together
- Knowledge Sharing: Whether reviews facilitate team learning
Performance Discussion Support:
- Recognition: Acknowledge developers who contribute to team quality
- Mentoring: Identify opportunities for review skill development
- Process Improvement: Ensure review processes are effective and inclusive
Review Score Ranges
| Score Range | Interpretation | Management Action |
|---|---|---|
| 80-100 | Review champion | Lead review processes, mentor others |
| 60-79 | Good reviewer | Continue current practices |
| 40-59 | Developing reviewer | Review training, more opportunities |
| 20-39 | Limited reviewer | Intensive review training, support |
| 0-19 | Minimal reviewer | Review process integration, guidance |
Combined Score Analysis
Overall Developer Assessment
The four scores work together to provide a comprehensive view:
High Performer Profile:
- Weighted Contribution: 80-100 (High technical impact)
- Consistency: 60-100 (Reliable work patterns)
- Code Health: Score > 50 (Improves code quality)
- Security Health: 80-100 (Enhances security posture)
- Review Score: 80-100 (Excellent reviewer and collaborator)
Balanced Contributor Profile:
- Weighted Contribution: 40-79 (Moderate technical impact)
- Code Health: Score ≈ 50 (Maintains code quality)
- Security Health: 50-79 (Security-neutral impact)
- Review Score: 40-79 (Good reviewer with room for improvement)
Development Focus Profile:
- Weighted Contribution: 80-100 (High technical impact)
- Code Health: Score < 50 (May introduce quality issues)
- Security Health: Variable (Security impact varies)
- Review Score: Variable (Review contribution varies)
Team Player Profile:
- Weighted Contribution: 40-79 (Moderate technical impact)
- Code Health: Score > 50 (Improves code quality)
- Security Health: 50-79 (Security-neutral impact)
- Review Score: 80-100 (Excellent reviewer and team collaborator)
Team Performance Insights
Team Strengths:
- High Contribution + High Quality: Team excels at both productivity and quality
- High Contribution + High Security: Team prioritizes both output and security
- High Review Scores: Team has strong collaboration and knowledge sharing
- Balanced Scores: Team maintains good overall performance
Team Development Areas:
- Low Quality Scores: May need code review process improvements
- Low Security Scores: May need security training or tooling
- Low Review Scores: May need review process improvements or collaboration training
- Variable Contribution: May need workload balancing or skill development
Management Applications
Performance Reviews:
- Objective Metrics: Use scores to support performance discussions
- Trend Analysis: Track improvement over time
- Goal Setting: Establish targets for each score category
Team Development:
- Mentoring Programs: Pair high performers with developing team members
- Training Planning: Identify areas where team training would be beneficial
- Process Improvement: Use insights to enhance development workflows
- Review Process Enhancement: Improve code review effectiveness and collaboration
Resource Planning:
- Workload Distribution: Balance high and low contributors appropriately
- Project Assignment: Match developer strengths to project requirements
- Succession Planning: Identify and develop future team leaders
Score Interpretation Guidelines
Weighted Contribution Score Ranges
| Score Range | Interpretation | Management Action |
|---|---|---|
| 90-100 | Exceptional contributor | Recognition, leadership opportunities |
| 70-89 | High performer | Mentoring others, complex projects |
| 50-69 | Solid contributor | Skill development, challenging tasks |
| 30-49 | Developing contributor | Support, training, clear expectations |
| 0-29 | Limited contributor | Intensive support, performance plan |
Consistency Score Ranges
| Score Range | Interpretation | Management Action |
|---|---|---|
| 80-100 | Highly consistent | Reliable planning, steady projects |
| 60-79 | Good consistency | Continue current work patterns |
| 40-59 | Moderate consistency | Work pattern optimization |
| 20-39 | Inconsistent | Process improvement, support |
| 0-19 | Highly irregular | Intensive support, process review |
Code Health Score Ranges
| Score Range | Interpretation | Management Action |
|---|---|---|
| 80-100 | Quality champion | Code review leadership, best practices |
| 60-79 | Quality improver | Continue current practices |
| 45-59 | Quality neutral | Minor guidance, maintain standards |
| 30-44 | Quality concern | Training, mentoring, review focus |
| 0-29 | Quality issue | Intensive support, process review |
Security Health Score Ranges
| Score Range | Interpretation | Management Action |
|---|---|---|
| 90-100 | Security champion | Security leadership, training others |
| 70-89 | Security conscious | Continue security focus |
| 50-69 | Security neutral | Security awareness training |
| 30-49 | Security concern | Security training, review focus |
| 0-29 | Security risk | Intensive security training, monitoring |
Review Score Ranges
| Score Range | Interpretation | Management Action |
|---|---|---|
| 80-100 | Review champion | Lead review processes, mentor others |
| 60-79 | Good reviewer | Continue current practices |
| 40-59 | Developing reviewer | Review training, more opportunities |
| 20-39 | Limited reviewer | Intensive review training, support |
| 0-19 | Minimal reviewer | Review process integration, guidance |
Best Practices for Using Impact Scores
Regular Monitoring
- Weekly Reviews: Check for significant changes or trends
- Monthly Analysis: Comprehensive review of all three scores
- Quarterly Assessment: Long-term performance evaluation
Contextual Interpretation
- Experience Level: Consider developer seniority and experience
- Project Phase: Different phases may require different focus areas
- Team Dynamics: Individual scores affect team performance
- Business Context: Align scores with business objectives
- Review Culture: Consider team's review process maturity and expectations
Actionable Feedback
- Specific Examples: Reference specific commits or issues
- Constructive Guidance: Provide clear improvement suggestions
- Resource Support: Offer training, mentoring, or tools
- Recognition: Celebrate improvements and achievements
Continuous Improvement
- Process Refinement: Use insights to improve development workflows
- Training Development: Identify and address skill gaps
- Tool Enhancement: Implement tools that support better performance
- Culture Building: Foster environment that values quality and security
- Review Process Optimization: Enhance code review effectiveness and collaboration
📚 Related Documentation
- Developer Overview - Complete developer analytics
- Repository Analytics - Project-level insights
- Team Performance - Team-level analytics
- Performance Management - Managing developer performance