DORA Metrics
DevOps Research and Assessment metrics for performance evaluation
GitPulse provides DORA (DevOps Research and Assessment) metrics to help you evaluate your team's DevOps performance. These metrics are based on the research from Google's State of DevOps Report and the book "Accelerate" by Nicole Forsgren, Jez Humble, and Gene Kim.
Overview
DORA metrics are four key performance indicators that measure the effectiveness of your DevOps practices:
- Deployment Frequency - How often you deploy to production
- Lead Time for Changes - How long it takes to go from code commit to production deployment
- Change Failure Rate - Percentage of deployments causing a failure in production
- Mean Time to Recovery (MTTR) - How long it takes to restore service after a production failure
Currently, GitPulse calculates Deployment Frequency and Lead Time for Changes (both LT1 and LT2 variants).
Performance Grades
Each metric is classified into one of four performance levels based on industry benchmarks:
🟢 Elite
- Color: Green
- Description: Top-tier performance, exceptional DevOps practices
- Impact: Organizations at this level typically have the highest business outcomes
🔵 High
- Color: Blue
- Description: Above-average performance, good DevOps practices
- Impact: Strong business outcomes, competitive advantage
🟡 Medium
- Color: Yellow
- Description: Average performance, room for improvement
- Impact: Standard business outcomes, potential for optimization
🔴 Low
- Color: Red
- Description: Below-average performance, needs attention
- Impact: May indicate bottlenecks or process issues
Metric Details
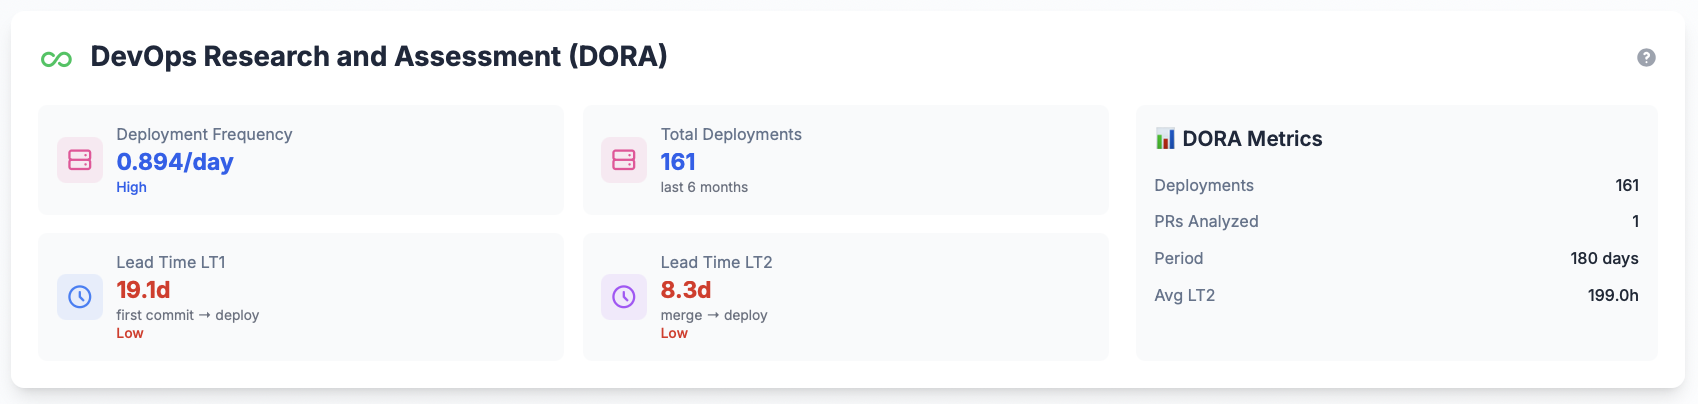
1. Deployment Frequency
What it measures: How often your team successfully deploys code to production.
Calculation: Number of production deployments in the last 6 months ÷ 180 days
Performance Benchmarks:
- 🟢 Elite: ≥ 1.0 deployments/day (several times per day)
- 🔵 High: 0.14 - 0.99 deployments/day (once per day to once per week)
- 🟡 Medium: 0.03 - 0.13 deployments/day (once per week to once per month)
- 🔴 Low: < 0.03 deployments/day (less than once per month)
Why it matters
Higher deployment frequency correlates with:
- Faster time to market
- Reduced risk per deployment
- Better customer satisfaction
- Improved team productivity
2. Lead Time for Changes - LT1
What it measures: Time from the first commit to successful production deployment.
Calculation: Median time between the earliest commit in a pull request and the deployment that includes that PR.
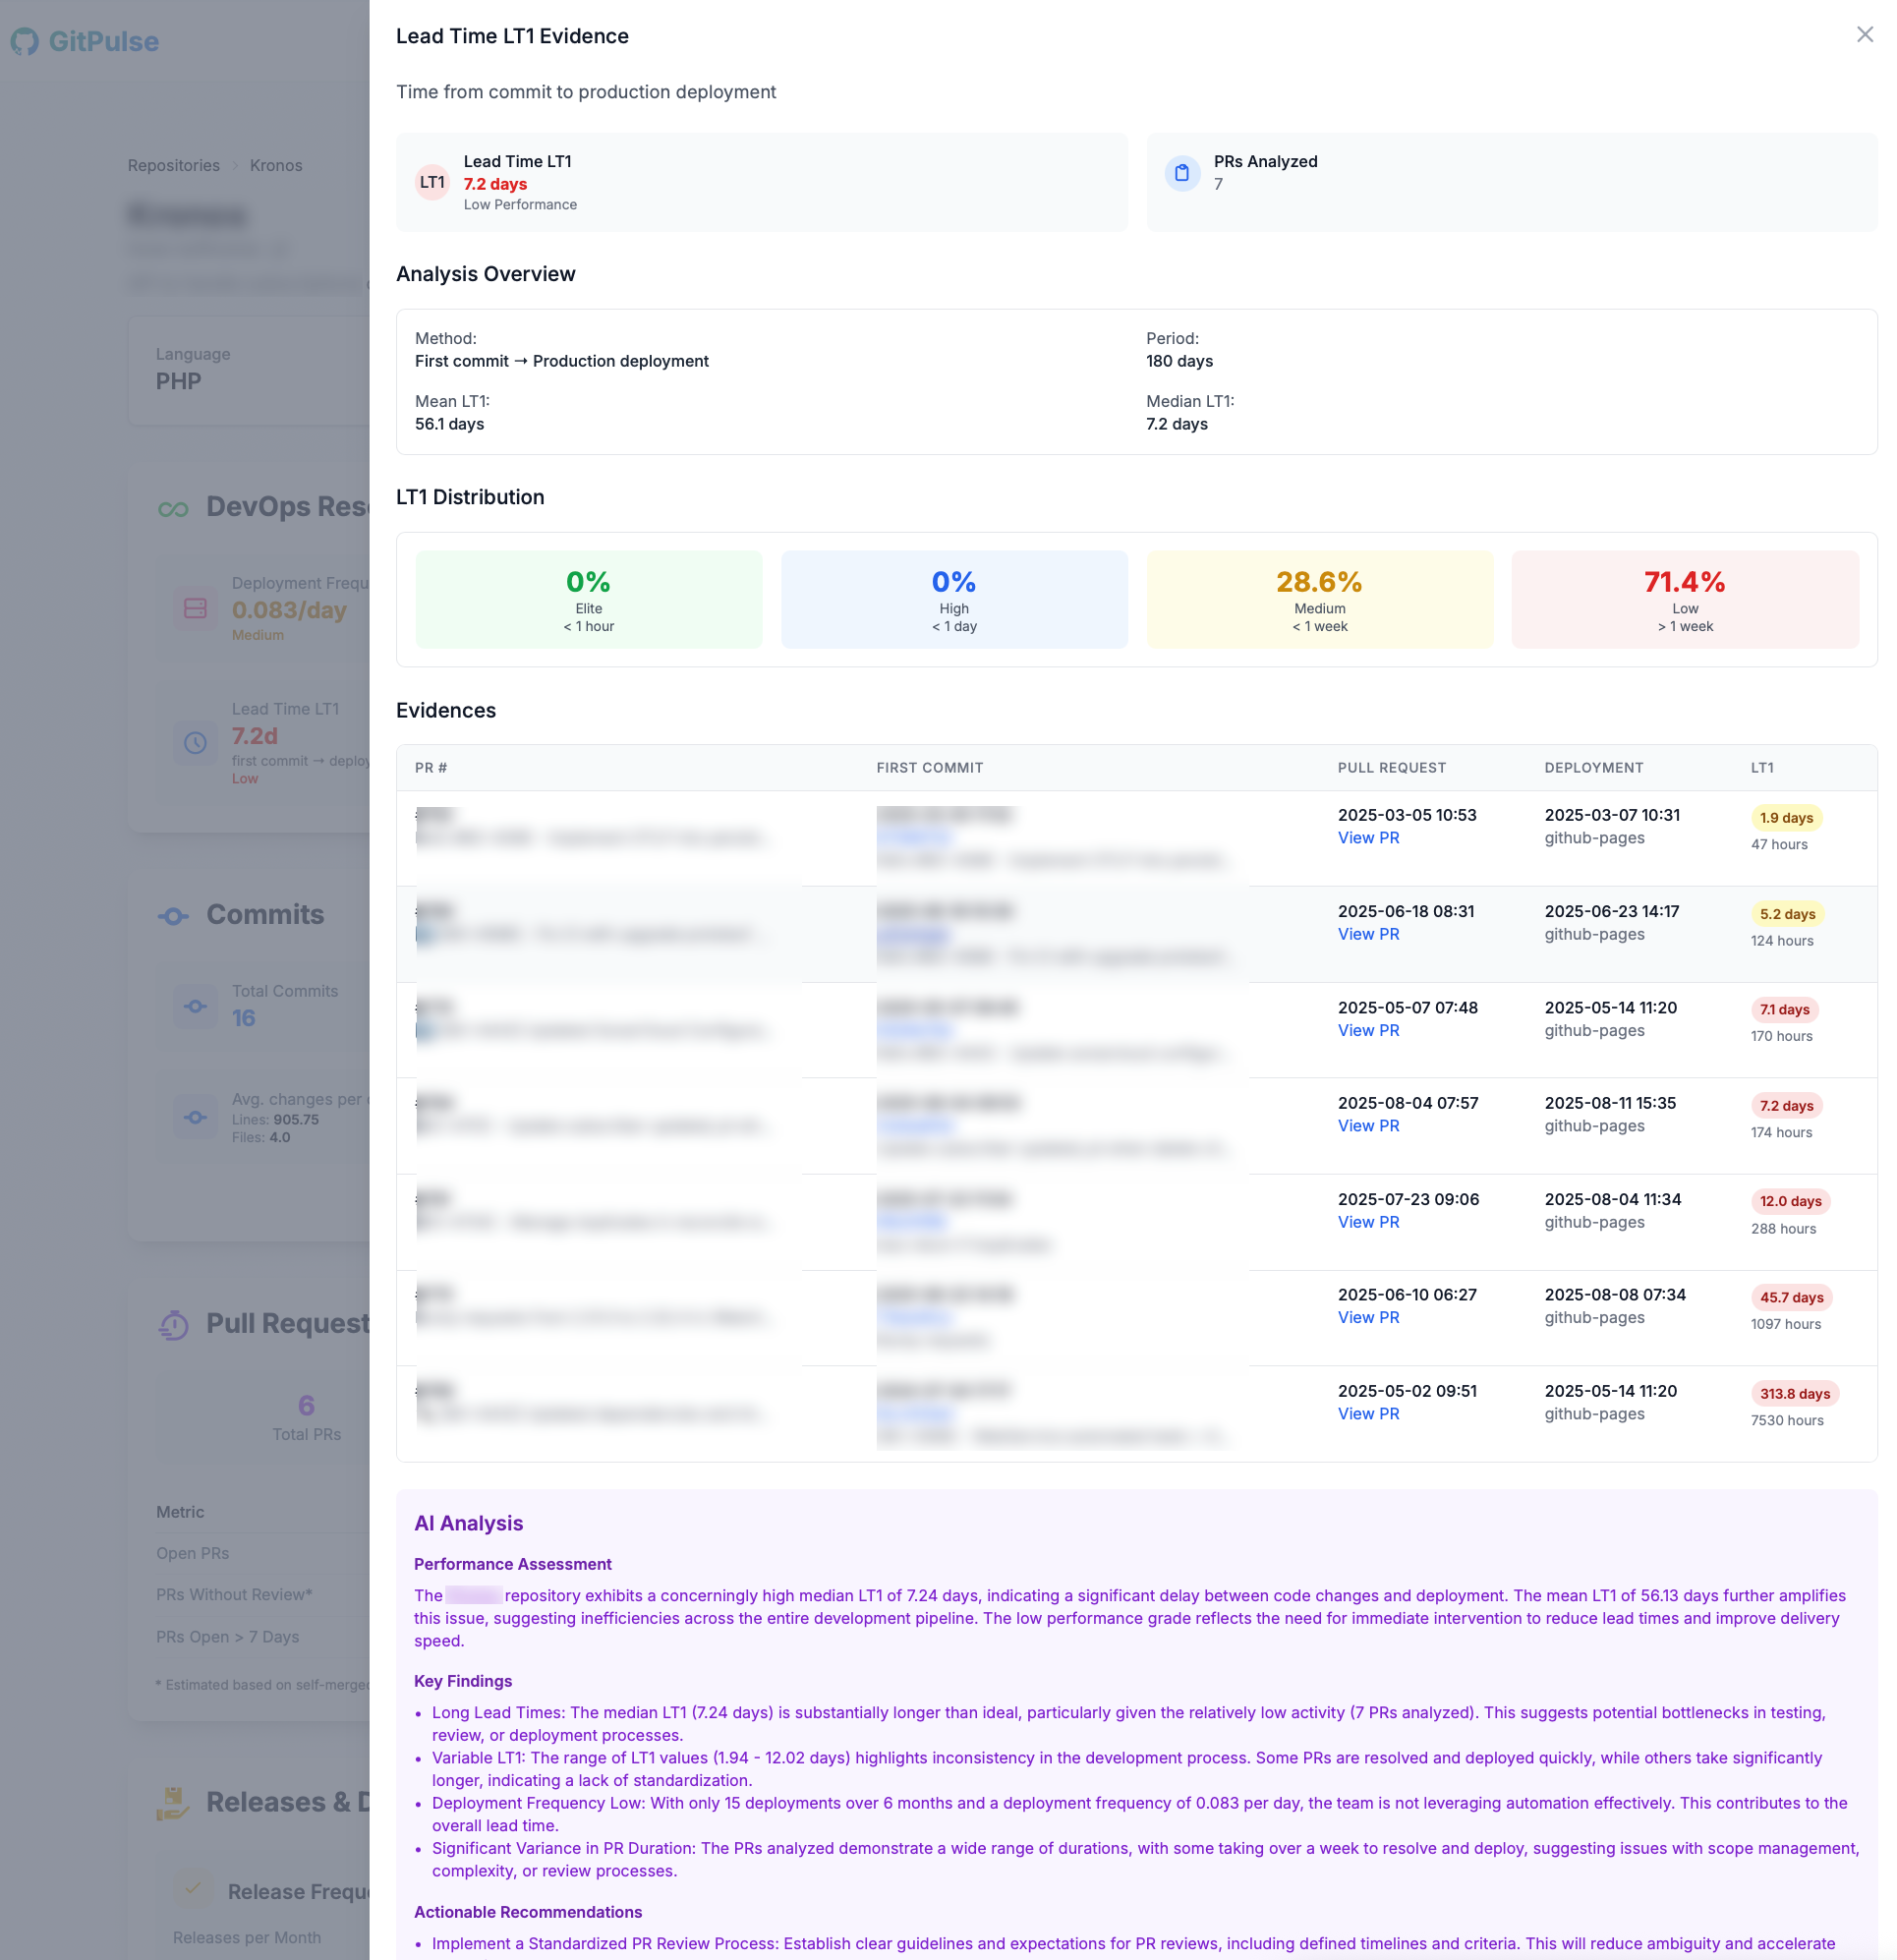
Performance Benchmarks:
- 🟢 Elite: < 0.042 days (< 1 hour)
- 🔵 High: 0.042 - 1.0 days (1 hour to 1 day)
- 🟡 Medium: 1.0 - 7.0 days (1 day to 1 week)
- 🔴 Low: > 7.0 days (> 1 week)
Why it matters
Shorter lead times indicate:
- Faster feedback loops
- Reduced context switching
- Better code quality
- Improved developer productivity
3. Lead Time for Changes - LT2
What it measures: Time from pull request merge to successful production deployment.
Calculation: Median time between PR merge and the deployment that includes that PR.
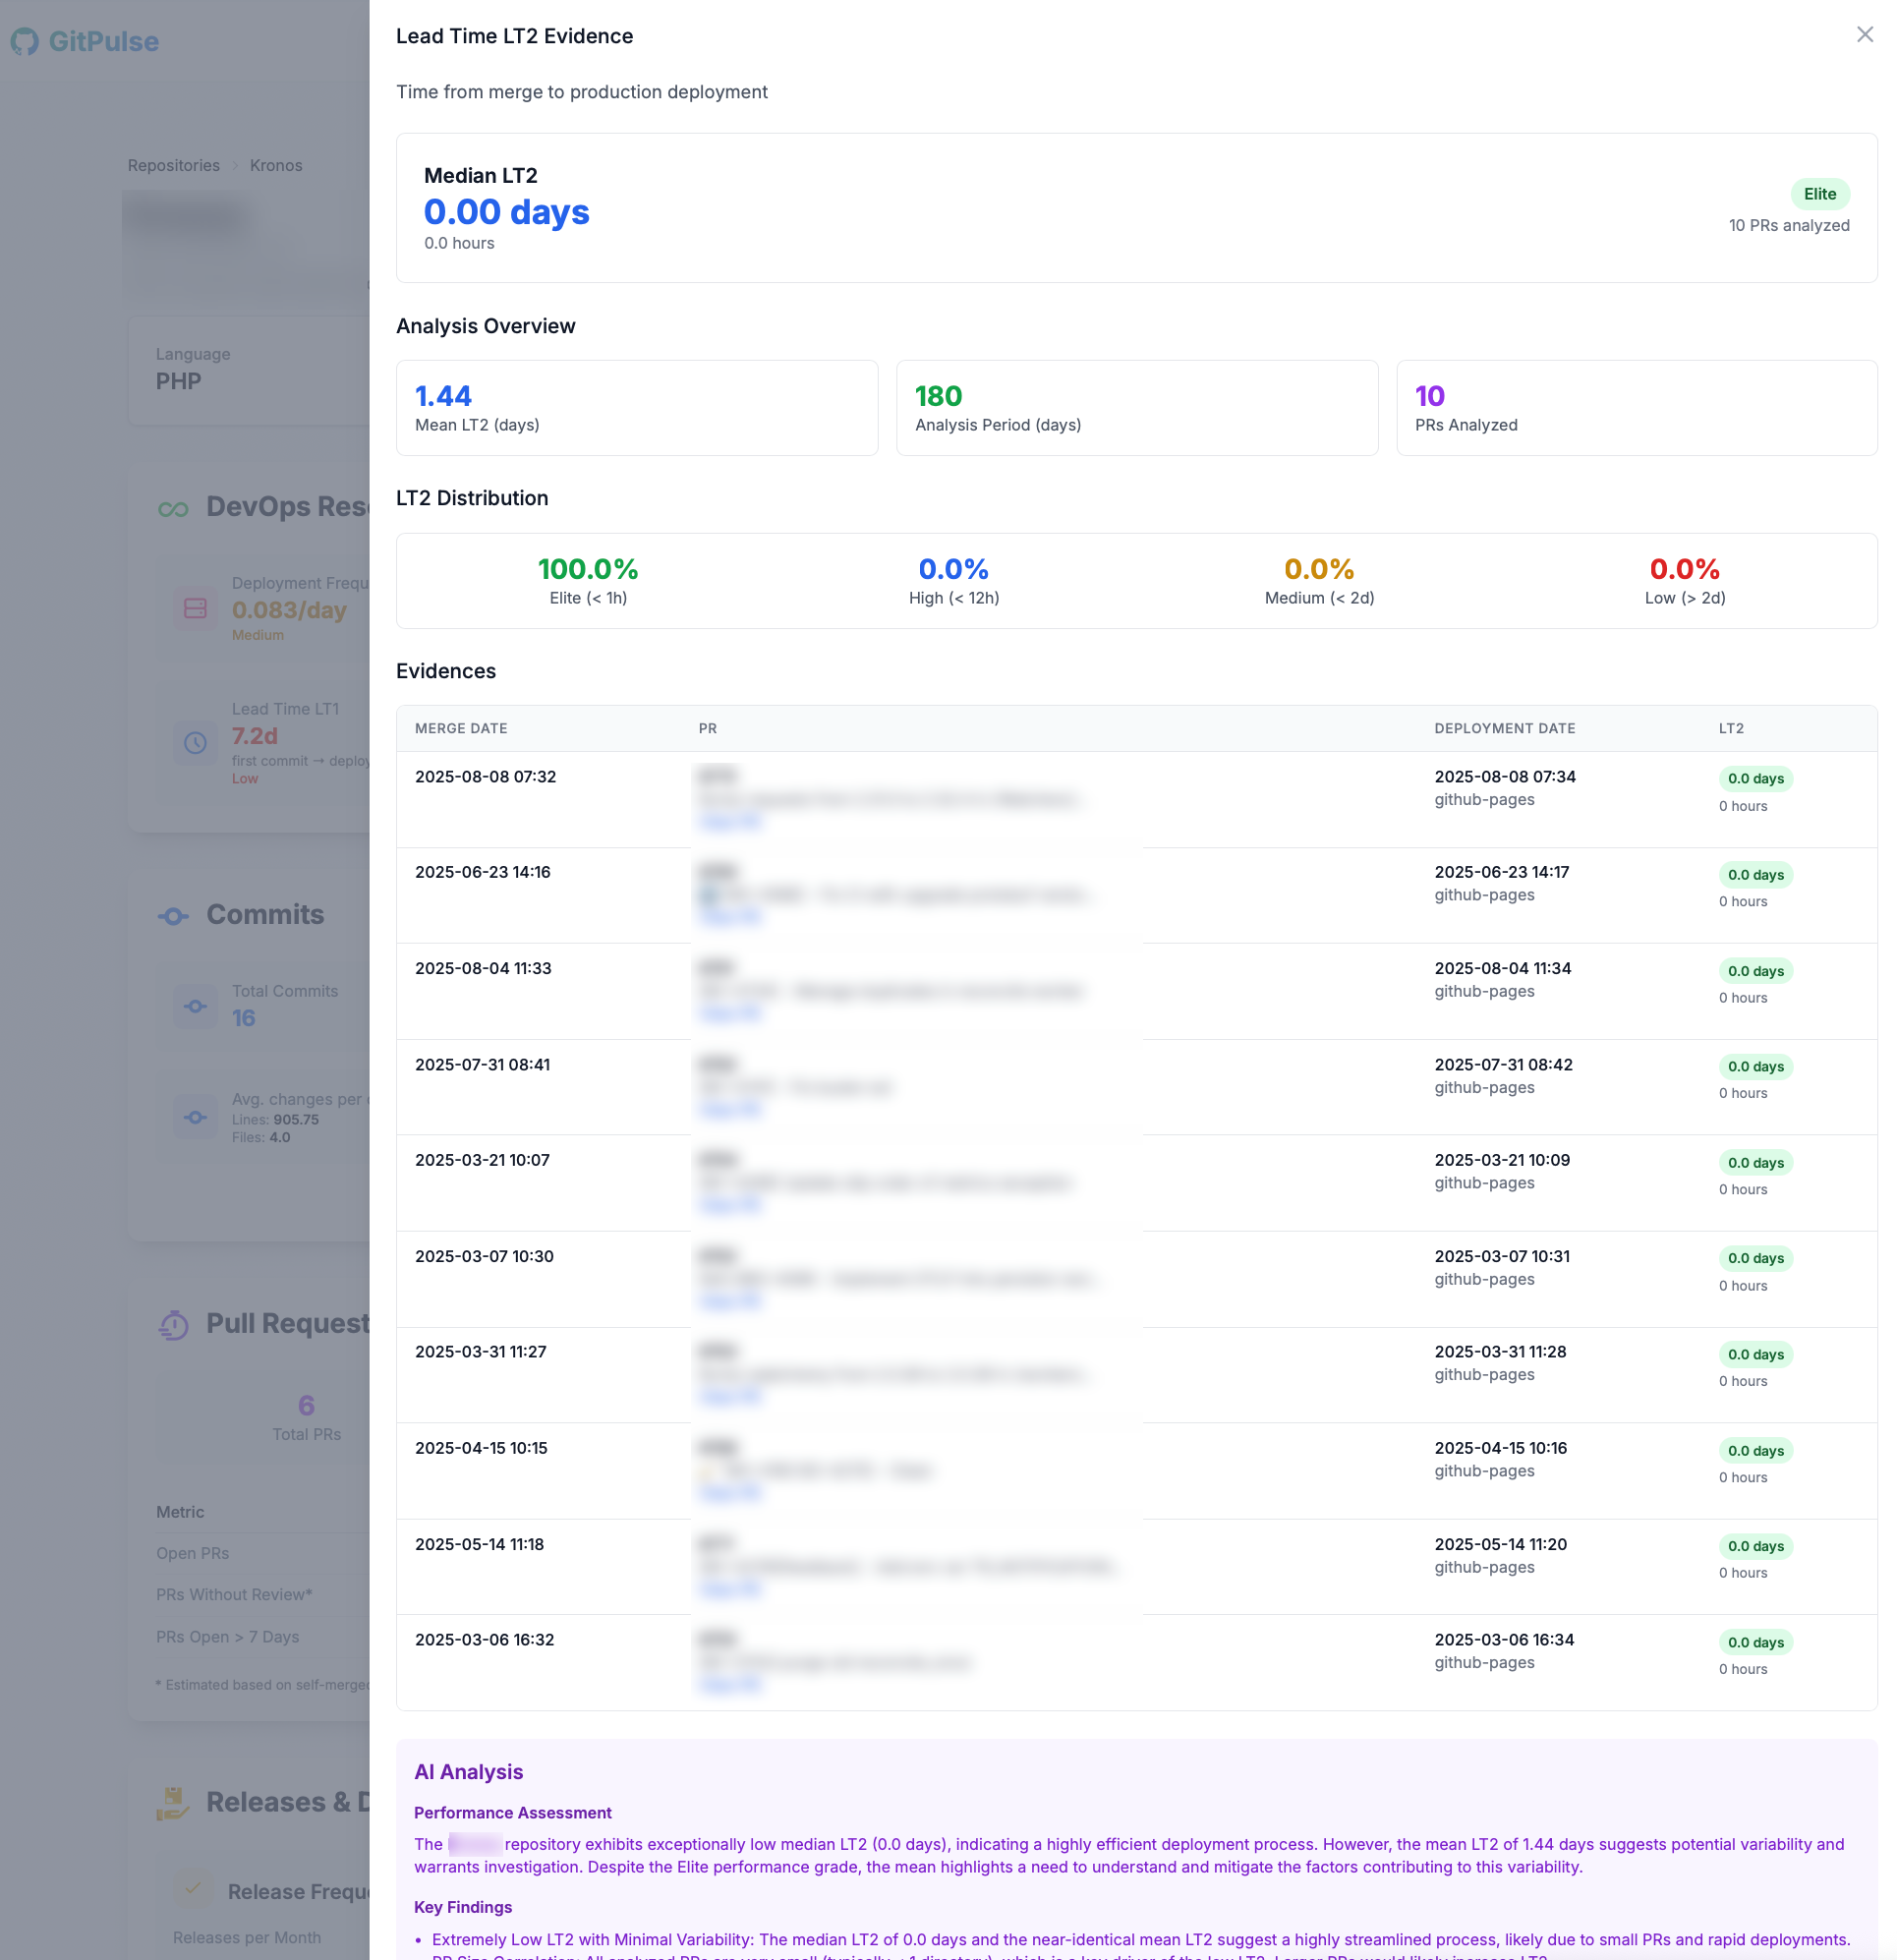
Performance Benchmarks:
- 🟢 Elite: < 0.042 days (< 1 hour)
- 🔵 High: 0.042 - 0.5 days (1 hour to 12 hours)
- 🟡 Medium: 0.5 - 2.0 days (12 hours to 2 days)
- 🔴 Low: > 2.0 days (> 2 days)
Why it matters
This metric specifically measures:
- Deployment pipeline efficiency
- Release process automation
- Time from "code ready" to "code live"
Data Requirements
To calculate DORA metrics, GitPulse requires:
For Deployment Frequency:
- Production deployments with success statuses
- Environment information (to identify production deployments)
For Lead Time Calculations:
- Pull requests with merge
- Deployment
Production Environment Detection:
GitPulse automatically identifies production deployments by looking for:
- Environment names containing "production", "prod", "live"
- GitHub Pages deployments (
github-pagesenvironment) - Deployments with success statuses
Interpreting Your Results
High Performance Indicators:
- Elite grades across all metrics
- Consistent deployment patterns
- Short lead times with low variance
Areas for Improvement:
- Low or Medium grades
- High variance in lead times
- Infrequent deployments
- Long delays between merge and deployment
Next Steps:
- If Deployment Frequency is Low: Focus on automation, CI/CD pipeline improvements
- If Lead Times are High: Optimize review processes, reduce batch sizes, improve testing
- If LT2 is much higher than LT1: Focus on deployment automation and pipeline efficiency
Limitations
- Metrics are calculated over the last 6 months
- Requires sufficient data (at least 2 deployments for lead time calculations)
- Only considers successful deployments
- May not capture all deployment types (e.g., hotfixes, emergency deployments)
Future Enhancements
GitPulse plans to add:
- Change Failure Rate calculation
- Mean Time to Recovery (MTTR) metrics
- Historical trend analysis
- Custom time period selection