Bus Factor Analysis
Identify knowledge concentration risks and team resilience
GitPulse analyzes the "bus factor" of your development team to identify knowledge concentration risks and help you build more resilient teams.
Bus Factor Overview
Bus factor analysis measures how many developers would need to be unavailable before your project would come to a halt due to critical knowledge gaps. This metric helps you understand team resilience and identify areas where knowledge sharing is needed.
Understanding Bus Factor
What It Measures
The bus factor represents the minimum number of developers whose absence would halt a project due to critical knowledge gaps. A bus factor of 1 means only one person knows how to work on critical parts of the codebase.
What it tells you
- Team resilience to personnel changes
- Knowledge distribution across the team
- Risk level of knowledge concentration
- Areas needing knowledge transfer
Calculation Formula
Formula
For each file in your codebase:
Bus_Factor = Count(Unique_Developers_Who_Modified_File)
Overall_Bus_Factor = Average(Bus_Factor_All_Files)
Bottleneck_Percentage = (Files_With_Bus_Factor_≤1 / Total_Files) × 100
Risk Classification
Files are automatically classified based on their bus factor:
- Critical: Bus Factor ≤ 1.0 (🚨)
- High: Bus Factor ≥ 1.0 and < 2.0 (⚠️)
- Moderate: Bus Factor ≥ 2.0 and ≤ 3.0 (🟡)
- Low: Bus Factor > 3.0 (✅)
Risk Levels
Plage notation
- [1, 2[ signifie "1 inclus à 2 exclus" (1.0, 1.5, 1.9...)
- [2, 3] signifie "2 inclus à 3 inclus" (2.0, 2.5, 3.0...)
- ≤ 1 signifie "1 ou moins" (0.0, 0.5, 1.0...)
- > 3 signifie "strictement supérieur à 3" (3.1, 3.5, 4.0...)
| Bus Factor | Risk Level | Business Impact | Action Required |
|---|---|---|---|
| ≤ 1 | 🚨 CRITICAL | Project stops if developer leaves | IMMEDIATE - Knowledge transfer |
| [1, 2[ | ⚠️ HIGH | Significant delays if either developer unavailable | HIGH PRIORITY - Add more developers |
| [2, 3] | 🟡 MODERATE | Manageable risk with planning | MEDIUM PRIORITY - Monitor and improve |
| > 3 | ✅ LOW | Well-distributed knowledge | MAINTAIN - Current state is good |
What it tells you
- Immediate action priorities
- Risk assessment framework
- Resource allocation needs
- Knowledge transfer urgency
Bus Factor Metrics
Total Files Analyzed
The number of code files that have been analyzed for knowledge distribution patterns.
What it tells you
- Scope of analysis coverage
- Codebase complexity
- Analysis comprehensiveness
- Risk assessment scope
Bottleneck Files Count
The number of files where only one developer has the knowledge to work on them.
What it tells you
- Critical knowledge concentration
- Immediate risk areas
- Knowledge transfer priorities
- Team vulnerability points
Bottleneck Percentage
The percentage of analyzed files that represent knowledge bottlenecks.
What it tells you
- Overall team risk level
- Knowledge distribution health
- Process improvement needs
- Resource allocation priorities
Average Bus Factor
The average number of developers who can work on each file across your codebase.
What it tells you
- Overall team resilience
- Knowledge sharing effectiveness
- Cross-training success
- Team collaboration quality
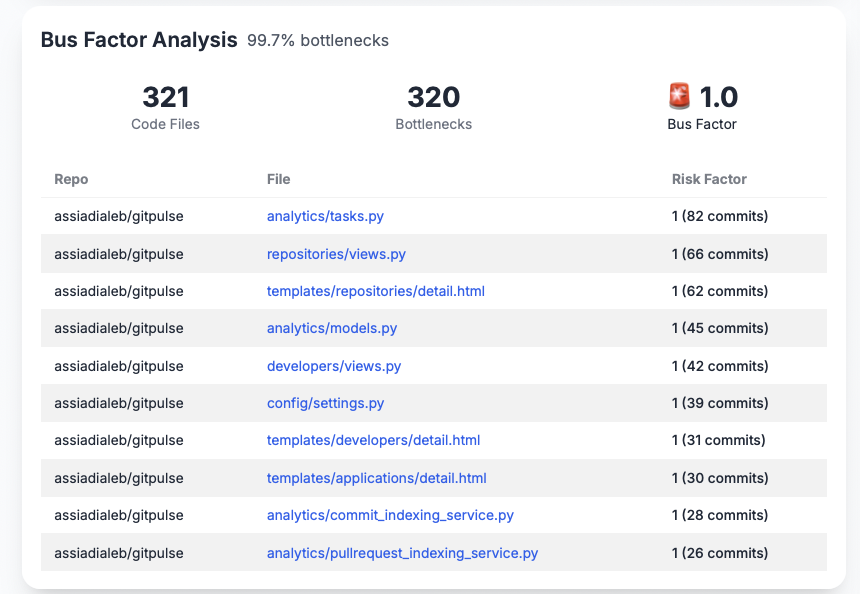
Top Risky Files
Risk Factor Analysis
The dashboard displays your top 10 most risky files, ranked by their bus factor (lowest to highest). Each file shows:
- Repository: The source repository
- File: The specific file path
- Risk Factor: Bus factor score and commit count
What it tells you
- Specific files needing attention
- Knowledge concentration locations
- Immediate action priorities
- Risk mitigation targets
File Risk Assessment
Files are categorized by risk level based on their bus factor:
- 🚨 Critical (Bus Factor ≤ 1): Only one developer knows this file
- ⚠️ High (Bus Factor [1, 2[): Only one to two developers can work on this file
- 🟡 Moderate (Bus Factor [2, 3]): Two to three developers have knowledge
- ✅ Low (Bus Factor > 3): Well-distributed knowledge
What it tells you
- Risk prioritization framework
- Action planning guidance
- Resource allocation needs
- Timeline for improvements
Using Bus Factor Data
For Development Teams
- Knowledge Sharing: Identify files needing cross-training
- Code Reviews: Ensure multiple developers understand critical files
- Documentation: Create knowledge transfer materials
- Pair Programming: Schedule sessions on bottleneck files
For Management
- Risk Assessment: Understand team vulnerability
- Resource Planning: Allocate training and knowledge transfer resources
- Succession Planning: Prepare for personnel changes
- Team Building: Identify collaboration opportunities
Best Practices
Improving Bus Factor
- Cross-Training: Rotate developers across different code areas
- Code Reviews: Ensure multiple developers review critical changes
- Documentation: Maintain clear documentation for complex systems
- Pair Programming: Encourage collaborative work on critical files
Team Collaboration
- Knowledge Sharing: Regular technical discussions and demos
- Mentoring: Senior developers guide others on critical areas
- Documentation: Create and maintain technical documentation
- Regular Assessments: Monitor bus factor trends over time
Risk Mitigation Strategies
Immediate Actions (Bus Factor 1)
- Knowledge Transfer Sessions: Schedule urgent training
- Documentation Creation: Document critical knowledge immediately
- Cross-Training: Assign backup developers to critical areas
- Monitoring: Track progress on knowledge transfer
Short-term Improvements (Bus Factor 2-3)
- Training Programs: Develop structured learning paths
- Code Reviews: Ensure multiple developers understand changes
- Documentation: Improve technical documentation
- Team Rotation: Rotate developers across different areas
Long-term Strategy (Bus Factor 4+)
- Maintenance: Continue current knowledge sharing practices
- Monitoring: Regular bus factor assessments
- Process Improvement: Optimize knowledge transfer processes
- Team Growth: Plan for sustainable knowledge distribution
Bus Factor Health Indicators
Healthy Knowledge Distribution
Good signs
- Average bus factor > 3.0
- Bottleneck percentage < 20%
- Multiple developers can maintain critical files
- Regular knowledge sharing activities
- Well-documented critical systems
Concerning Knowledge Patterns
Concerning patterns
- Average bus factor < 2.0
- Bottleneck percentage > 50%
- Critical files with single developer dependency
- No knowledge transfer processes
- Poor documentation of complex systems
Troubleshooting
Common Issues
High Bottleneck Percentage
- Cause: Insufficient knowledge sharing across team
- Solution: Implement cross-training and documentation programs
Critical Files (Bus Factor 1)
- Cause: Single developer responsible for critical areas
- Solution: Immediate knowledge transfer and backup assignment
Low Average Bus Factor
- Cause: Poor knowledge distribution across codebase
- Solution: Systematic cross-training and collaboration programs
Getting Help
- Regular Assessments: Monitor bus factor trends monthly
- Team Training: Invest in knowledge sharing programs
- Process Reviews: Assess knowledge transfer effectiveness
- Resource Allocation: Dedicate time for cross-training activities
📚 Related Documentation
- Developer Overview - Complete developer analytics
- Impact Score - Developer contribution analysis
- Repository Analytics - Codebase health insights